
Explore products
Start with our existing indicators and tools, and choose what fits your analysis.
Browse productsTrading products and custom development across markets
From our own trading indicators to custom strategy development,
BullTrading connects market analysis, rule research and tool development.
FIND YOUR NEXT TOOL
Start with a product,
or start with an idea.
Start with our existing indicators and tools, and choose what fits your analysis.
Browse productsTurn your analysis rules, chart display and alert requirements into a custom indicator.
Assess execution, order management and testing needs around a clearly defined strategy.
PRODUCTS
Explore what each product does, where it works and how to access it. Choose the tools that fit your needs.
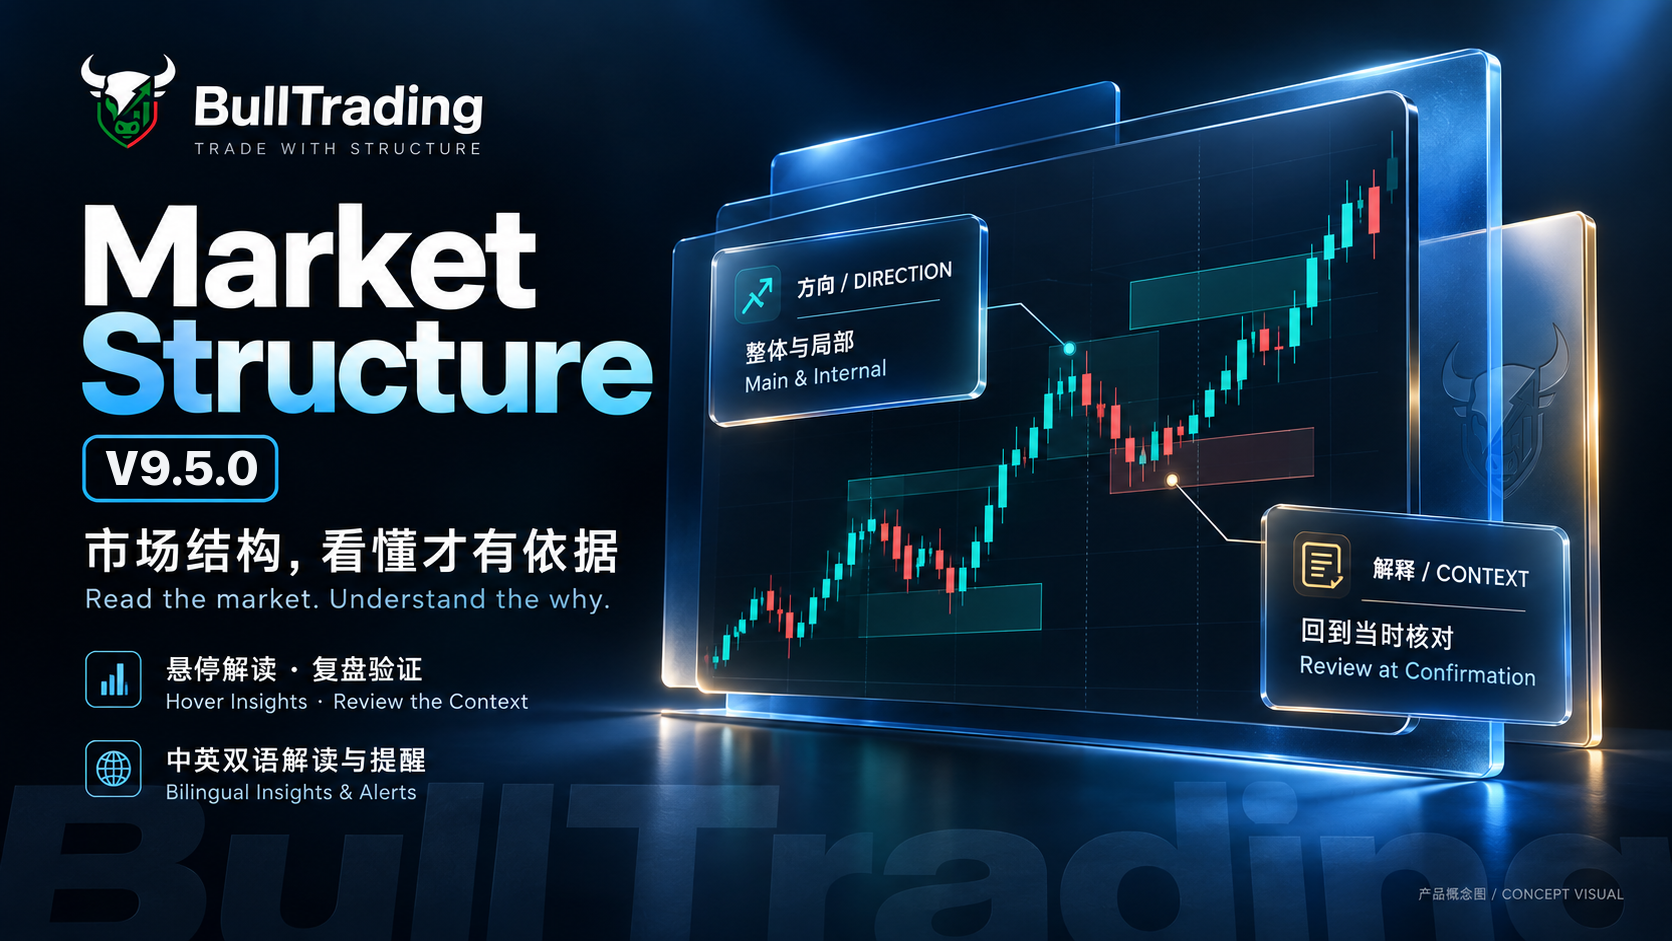
You can read the market. False breakouts keep fooling you.
V9.5.0 is available. It confirms a breakout only when the candle closes with enough strength, and every mark explains why and where it would be wrong. Support zones, pullback zones and protective levels are drawn on the chart, with explanations and alerts in English and Chinese. Free 1-day trial, no automatic renewal.
All plans include the same product benefits; only the access period differs. Support handles activation and renewal manually. There is no automatic renewal.
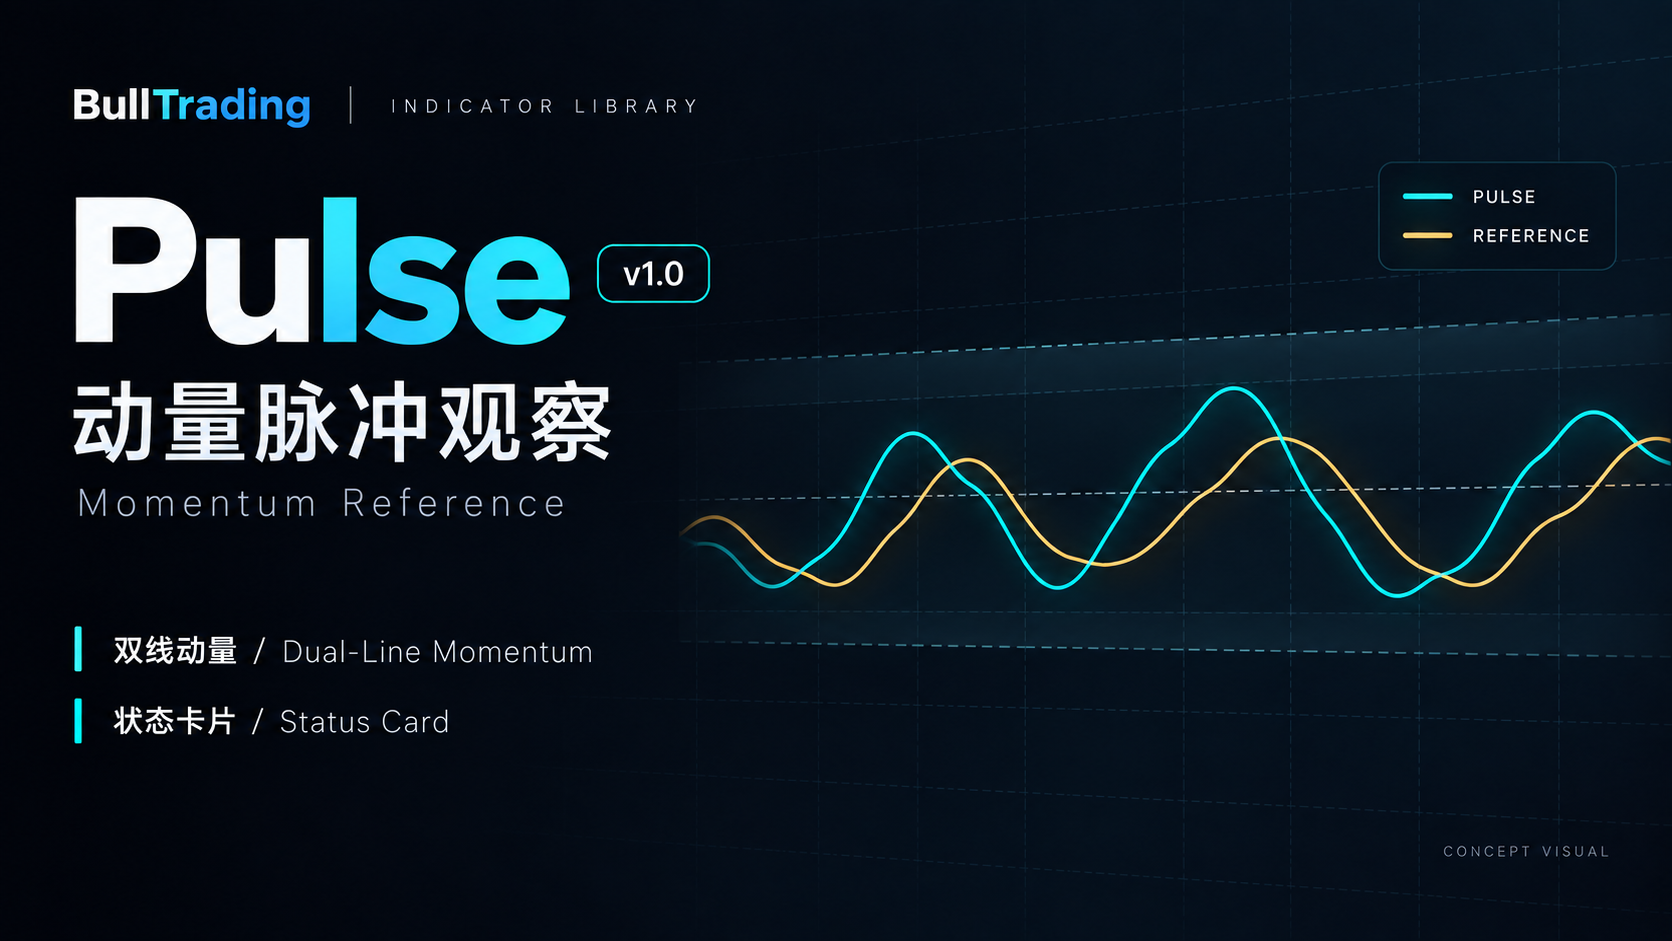
Observe market momentum through two lines and a compact status card, with subtle reference zones, Chinese and English interfaces, and light and dark themes.
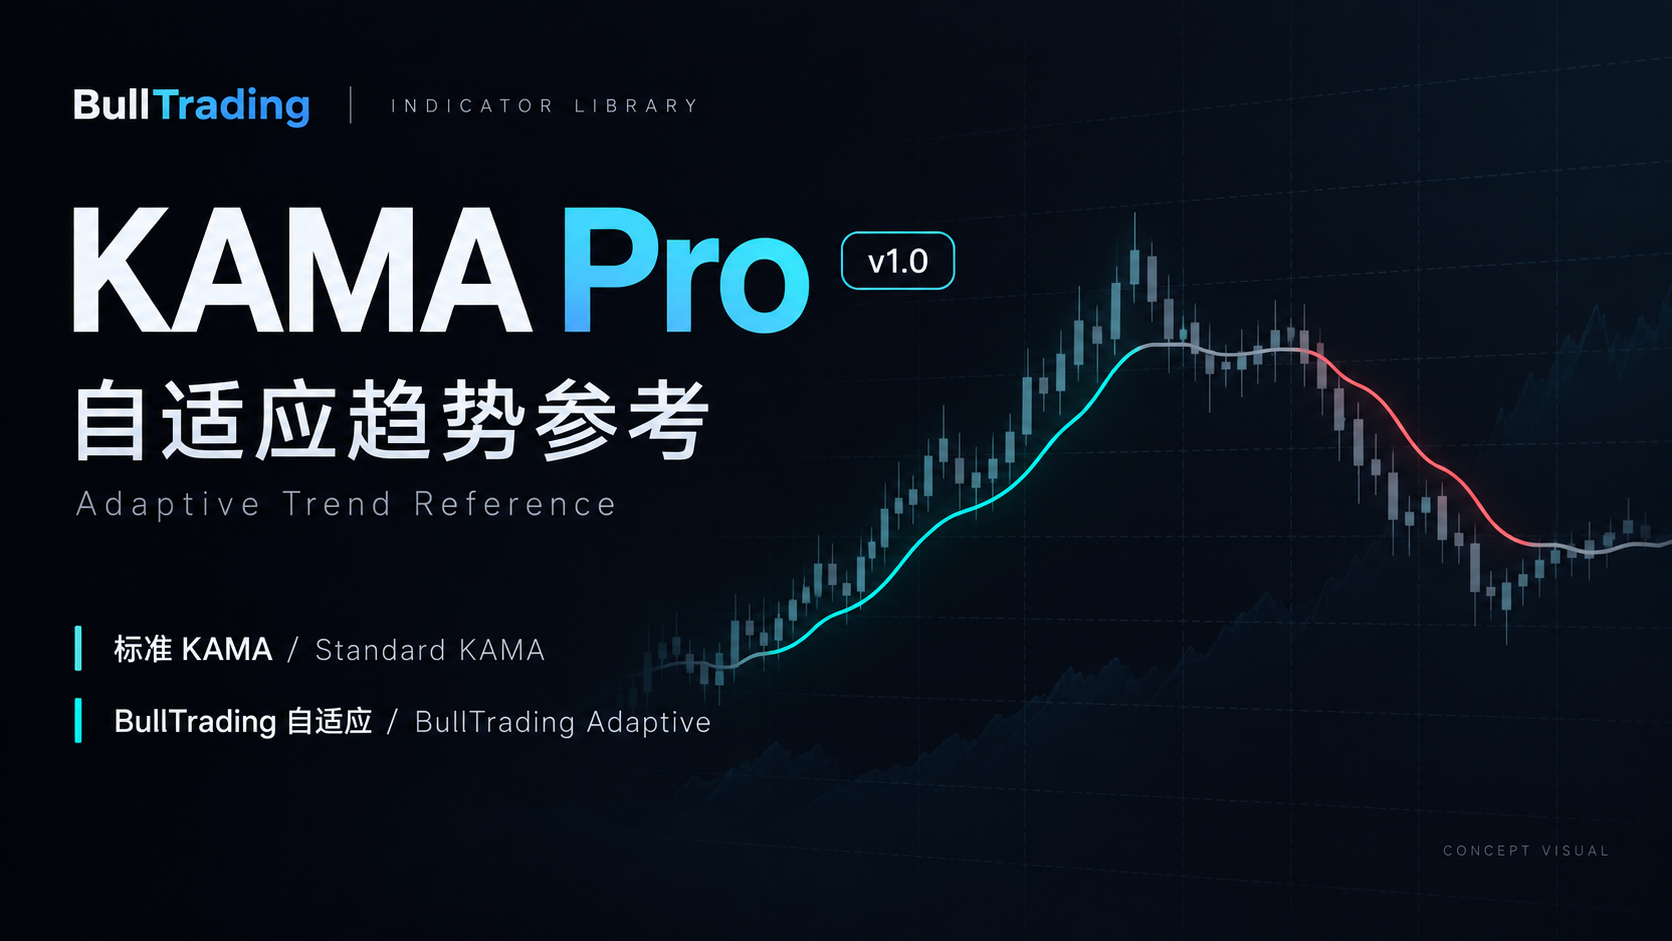
Built on Kaufman’s Adaptive Moving Average (KAMA), with two algorithms, directional colors and closed-bar display to observe price trends through one line.
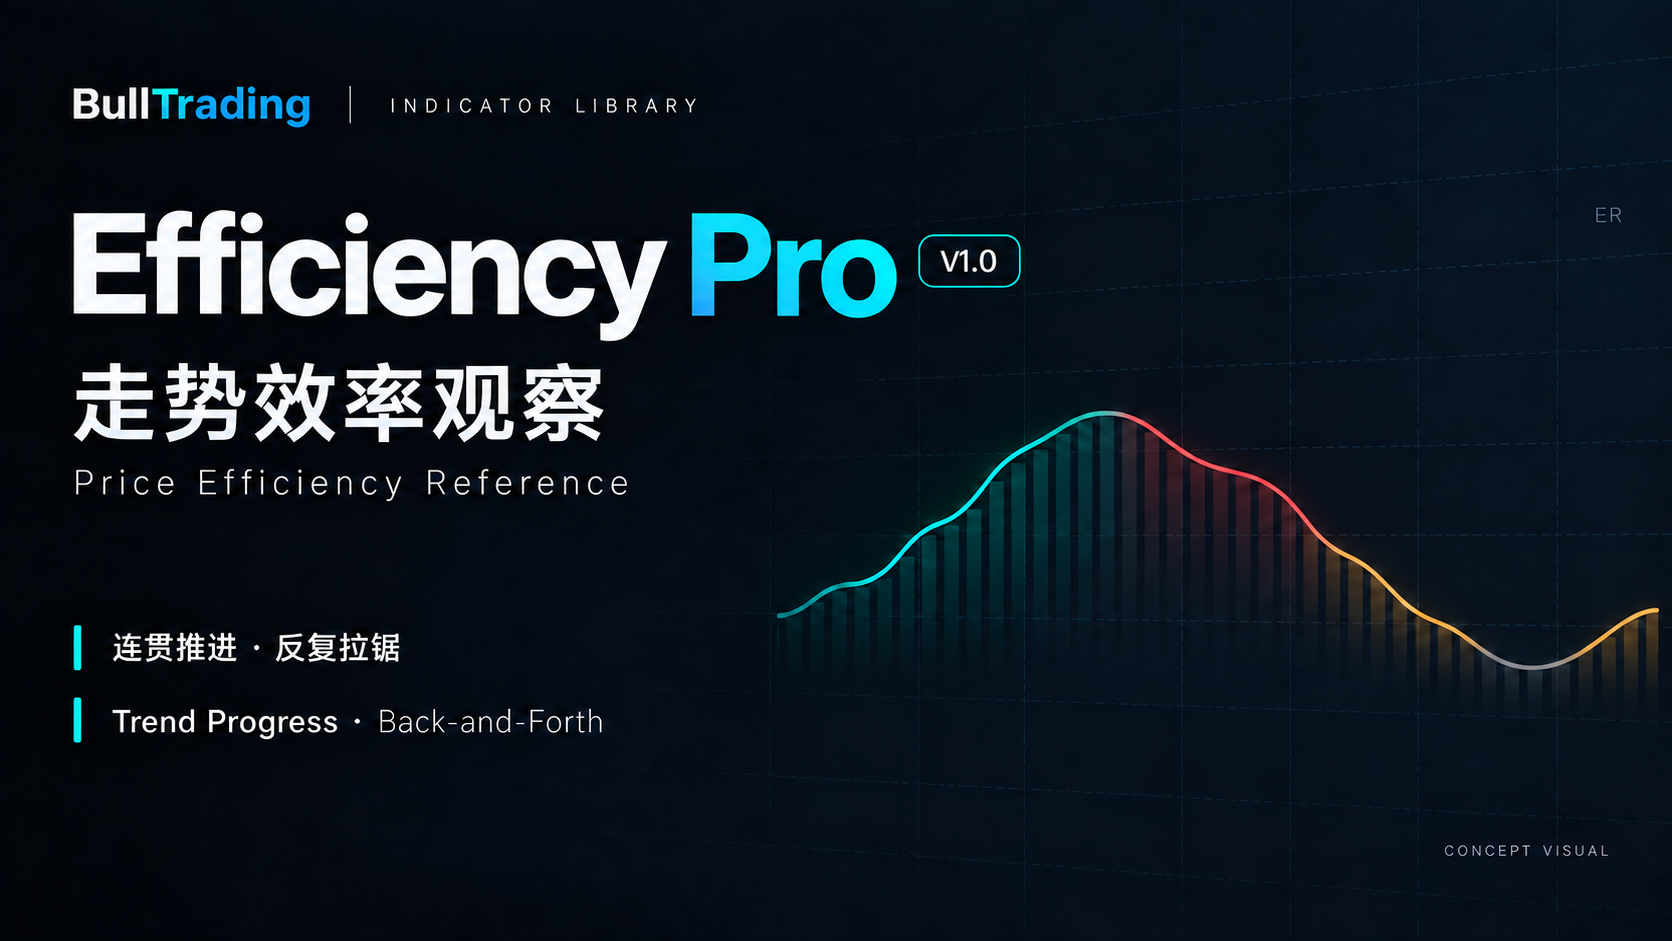
Use the Efficiency Ratio (ER) to measure how consistently price progresses, distinguish directional movement from back-and-forth action, and add context for trend following and range identification.
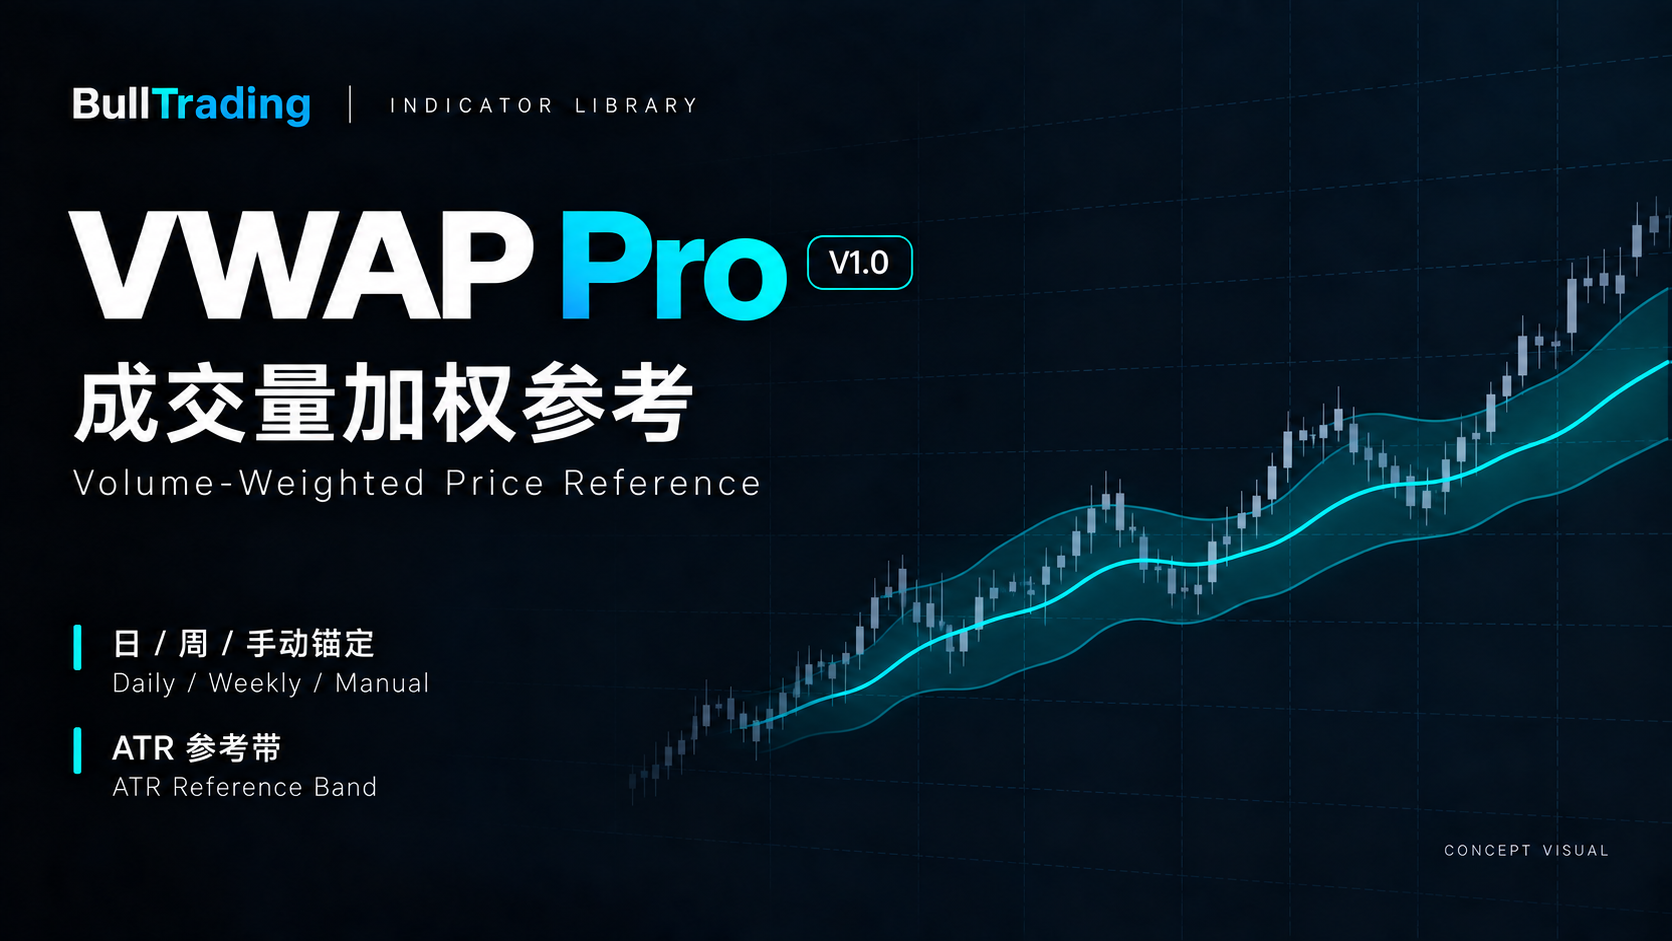
Use an anchored volume-weighted reference and an ATR band to observe price location and distance within the selected interval.
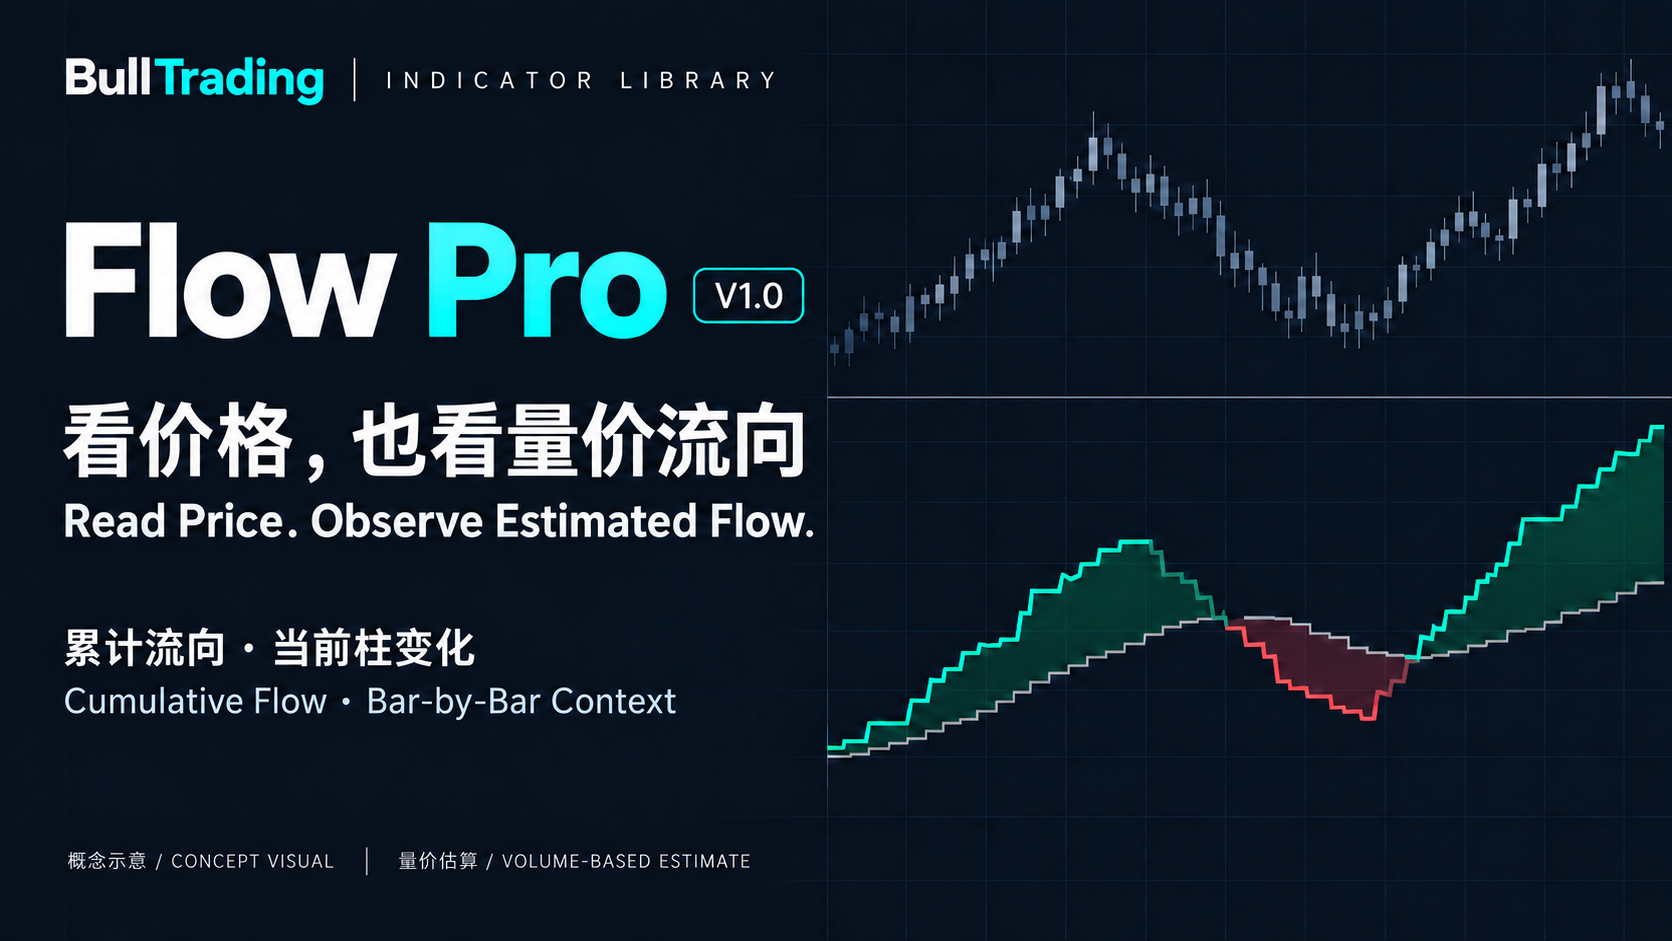
Add a volume-based perspective to price action.
Combine each bar’s close location and volume to view cumulative estimated flow, a recent reference and the current bar’s contribution in one pane alongside price action.
Give each opportunity a process, a plan and a review.
You understand the market. What comes next? Explore a proposed workflow from attention to confirmation, invalidation and review, with a reason behind each step.
Strategy features still require development and validation; access is not open.
CUSTOM DEVELOPMENT
From requirements to testing, turn your analysis methods, alert conditions and execution rules into a clear tool specification.
Source delivery, intellectual property, maintenance and fees are agreed per project. Development services do not promise trading returns.
Supported platforms and project scope are confirmed after reviewing the rules, available data and requirements.
BUILT AROUND YOUR MARKET
Designed for multiple markets, with each platform and its data requirements in mind.
Market coverage does not imply platform support. Each product specifies its own supported scope.
RESEARCH & METHODS
Research areas and development methods.
Define the problem before choosing a solution.
RESOURCES & COMMUNITY
A product guide or a conversation is a good place to start.
Learn to observe trend direction and price position with an adaptive moving average, and adjust its display to your chart-reading needs.
Free indicator · Available nowPLATFORMS & TOOLS
Introductions and access links for charting and research tools.
A charting and analysis platform for multiple markets, with price charts, technical indicators and custom indicators written in Pine Script.
TradingView access depends on your region, network connection and the platform’s current rules. For connection issues, check TradingView’s official help and service status.
Products and availability depend on each platform’s current terms, supported regions and account eligibility.
LET’S BUILD SOMETHING USEFUL
